
See All Formulas in a Excel Sheet at Once


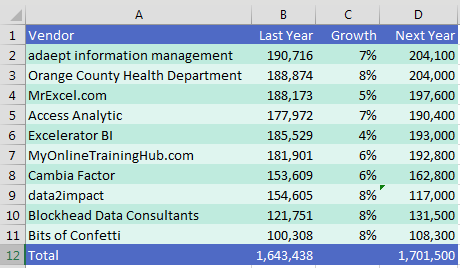
You have a spreadsheet from a former co-worker and you need to figure out how the calculations work. You could visit each cell, one at a time, and look at the formula in the formula bar. Or you could quickly toggle between pressing F2 and Esc to see the formula right in the cell.

A spreadsheet has a mix of text and numbers.

But there is a faster way. On most U.S. keyboards, just below the Esc key is a key with two accent characters: the tilde from Spanish and the grave accent from French. It is an odd key. I don’t know how I would ever use this key to actually type piñata or frère .

Just under the Escape key, there is a key with a Tilde and a Grave Accent. Hold down Ctrl and press this key to toggle into Show Formulas Mode.

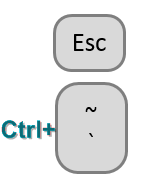
If you hold down Ctrl and this key, you toggle into something called Show Formulas mode. Each column gets wider, and you see all of the formulas.

In show formulas mode, the columns become slightly wider and you see the formulas in each cell instead of the values.

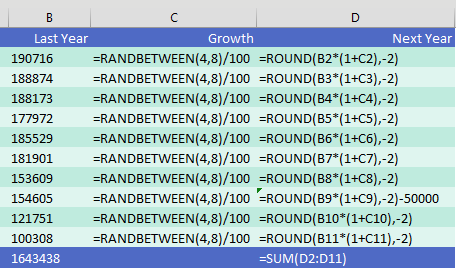
This gives you a view of all the formulas at once. It is great for spotting “plug” numbers (B9) or when someone added the totals with a calculator and typed the number instead of using =SUM(). You can see that the co-worker left RANDBETWEEN functions in this model.

Note

Here is another use for the Tilde key. Say you need to use the Find dialog to search for a wildcard character (such as the * in "Wal*Mart" or the ? in "Hey!?" Precede the wildcard with a tilde. Search for Wal~*Mart or Hey!~?.

Tip

To type a lowercase n with a tilde above, hold down Alt while pressing 164 on the number keypad. Then release Alt.

Comments

Popular posts from this blog

40 Power Query Editor features in Power BI

40 Power Query Editor features in Power BI along with examples: 1. Filter Rows: Remove rows based on conditions. Example: Remove rows with a null value in the "CustomerName" column. 2. Remove Duplicates: Eliminate duplicate rows. Example: Remove duplicate entries based on the "OrderID" column. 3. Sort Rows: Arrange rows in ascending or descending order. Example: Sort data by "Date" column in descending order. 4. Replace Values: Substitute one value with another. Example: Replace "N/A" with "Unknown" in the "Status" column. 5. Split Columns: Divide a column into multiple columns. Example: Split "FullName" into "FirstName" and "LastName." 6. Merge Queries: Combine data from multiple sources. Example: Merge customer and order data based on the "CustomerID." 7. Group By: Aggregate data based on a specific column. Example: Group sales data by "ProductCategory" and calculate the sum ...

20 Time Intelligence Dax Measures

20 Time Intelligence DAX measures in Power BI with examples: Year-to-Date Sales: css Copy code YTD Sales = TOTALYTD( [Total Sales] , Calendar [Date] ) Month-to-Date Sales: css Copy code MTD Sales = TOTALMTD( [Total Sales] , Calendar [Date] ) Quarter-to-Date Sales: css Copy code QTD Sales = TOTALQTD( [Total Sales] , Calendar [Date] ) Previous Year Sales: mathematica Copy code Previous Year Sales = CALCULATE ( [ Total Sales ] , SAMEPERIODLASTYEAR ( Calendar [ Date ] ) ) Year-over-Year Growth: css Copy code YoY Growth = DIVIDE( [Total Sales] - [Previous Year Sales] , [Previous Year Sales] ) Rolling 3-Month Average Sales: sql Copy code 3 M Rolling Avg Sales = AVERAGEX(DATESINPERIOD(Calendar[ Date ], MAX (Calendar[ Date ]), -3 , MONTH ), [Total Sales]) Cumulative Sales: scss Copy code Cumulative Sales = SUMX (FILTER(ALL(Calendar), Calendar [Date] <= MAX (Calendar[Date])), [Total Sales] ) Running Total Sales: scss Copy code Running Total Sales = SUMX (FILTER(ALL(Calendar), Calen...

Power BI MCP Server

AI-driven interaction with semantic models is starting to reshape the Power BI conversation. With Microsoft introducing MCP server capabilities (Preview), AI agents can interact directly with models — reducing the gap between a business question and a data response. From the perspective of delivering Power BI solutions across multiple enterprise clients, the potential is clear — but so are the responsibilities. Where this can help • Lower barrier for business users to explore data • Faster insight cycles through conversational access • Streamlined development and analytical workflows Where caution is required 🔐 Security, governance, and guardrails When AI agents interact with live semantic models, the exposure surface expands. This isn’t just about authentication — it’s about: • Enforcing robust role-based access and data segmentation • Monitoring query behavior and usage patterns • Preventing unintended access paths to sensitive datasets • Establishing guardrails around agent c...