
Trace Precedents which cells forform into a formula


If you need to see which cells flow into a formula, you can use the Trace Precedents command in the Formula Auditing group on the Formulas tab. In the following figure, select D6. Choose Trace Precedents. Blue lines will draw to each cell referenced by the formula in D6.

The dotted line leading to a symbol in B4 means there is at least one precedent on another worksheet. If you double-click the dotted line, Excel shows you a list of the off-sheet precedents.

A formula in D6 is referring to B10, A8, A6, B4, C2, D2, and one cell on another worksheet. Select D6 and Trace Precedents. Blue lines are drawn from D6 to each of the other cells. A dotted line is also drawn to a worksheet icon - this indicates one off-sheet precedent.

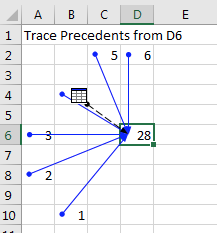
If you stay in cell D6 and choose Trace Precedents a few more times, you will see the second-level precedents, then the third-level precedents, and so on. When you are done, click Remove Arrows.

Comments

Popular posts from this blog

40 Power Query Editor features in Power BI

40 Power Query Editor features in Power BI along with examples: 1. Filter Rows: Remove rows based on conditions. Example: Remove rows with a null value in the "CustomerName" column. 2. Remove Duplicates: Eliminate duplicate rows. Example: Remove duplicate entries based on the "OrderID" column. 3. Sort Rows: Arrange rows in ascending or descending order. Example: Sort data by "Date" column in descending order. 4. Replace Values: Substitute one value with another. Example: Replace "N/A" with "Unknown" in the "Status" column. 5. Split Columns: Divide a column into multiple columns. Example: Split "FullName" into "FirstName" and "LastName." 6. Merge Queries: Combine data from multiple sources. Example: Merge customer and order data based on the "CustomerID." 7. Group By: Aggregate data based on a specific column. Example: Group sales data by "ProductCategory" and calculate the sum ...

20 Time Intelligence Dax Measures

20 Time Intelligence DAX measures in Power BI with examples: Year-to-Date Sales: css Copy code YTD Sales = TOTALYTD( [Total Sales] , Calendar [Date] ) Month-to-Date Sales: css Copy code MTD Sales = TOTALMTD( [Total Sales] , Calendar [Date] ) Quarter-to-Date Sales: css Copy code QTD Sales = TOTALQTD( [Total Sales] , Calendar [Date] ) Previous Year Sales: mathematica Copy code Previous Year Sales = CALCULATE ( [ Total Sales ] , SAMEPERIODLASTYEAR ( Calendar [ Date ] ) ) Year-over-Year Growth: css Copy code YoY Growth = DIVIDE( [Total Sales] - [Previous Year Sales] , [Previous Year Sales] ) Rolling 3-Month Average Sales: sql Copy code 3 M Rolling Avg Sales = AVERAGEX(DATESINPERIOD(Calendar[ Date ], MAX (Calendar[ Date ]), -3 , MONTH ), [Total Sales]) Cumulative Sales: scss Copy code Cumulative Sales = SUMX (FILTER(ALL(Calendar), Calendar [Date] <= MAX (Calendar[Date])), [Total Sales] ) Running Total Sales: scss Copy code Running Total Sales = SUMX (FILTER(ALL(Calendar), Calen...

Power BI MCP Server

AI-driven interaction with semantic models is starting to reshape the Power BI conversation. With Microsoft introducing MCP server capabilities (Preview), AI agents can interact directly with models — reducing the gap between a business question and a data response. From the perspective of delivering Power BI solutions across multiple enterprise clients, the potential is clear — but so are the responsibilities. Where this can help • Lower barrier for business users to explore data • Faster insight cycles through conversational access • Streamlined development and analytical workflows Where caution is required 🔐 Security, governance, and guardrails When AI agents interact with live semantic models, the exposure surface expands. This isn’t just about authentication — it’s about: • Enforcing robust role-based access and data segmentation • Monitoring query behavior and usage patterns • Preventing unintended access paths to sensitive datasets • Establishing guardrails around agent c...