Formatting In Excel - helps you find meaning in the spreadsheet


Formatting In Excel -  helps you find meaning in the spreadsheet 


Spreadsheets are often seen as boring and pure tools of utility, but that doesn't mean that we can't bring some style and formatting to our spreadsheets

Formatting helps your user find meaning in the spreadsheet without going through each and every individual cell. Cells with formatting will draw the viewer's attention to the important cells.

In Excel, formatting worksheet data is easy. You can use several fast and simple ways to create professional-looking worksheets that display your data effectively. For example, you can use document themes for a uniform look throughout all of your Excel spreadsheets, styles to apply predefined formats, and other manual formatting features to highlight important data.

Formatting a Data

Raw Data


Using Font, Number tabs as shown in image to do a simple formatting


Formatting a Data with help of formatting tools in Excel 

As shown in image , we have Product category wise data with Taxable value, Cost, Profit and Profit Ratio.

There are no gridlines, headers, formula bar and ribbon, these can be hidden with formatting tools.


In Below Image you can see Formula tab, header and gridlines


In Below image there is none. Untick gridlines, headings and formula bar.


Below is a Report prepared using various formatting tools like chart and Smart Art.


As shown above we can convert a simple data into a nice and presentable form with the help of formatting tools available in Excel.

As shown in image below, with this style of formatting and presenting a data there is no need to rework the data and show it in PowerPoint.


Types of Formatting 

Press Ctrl +1 or 

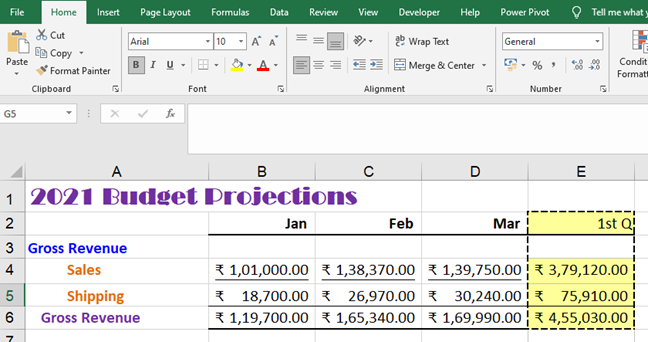
1. Numeric

I. Date formatting 


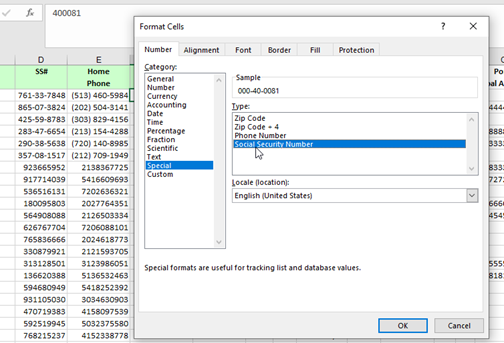
II. Special Formatting – Change Security code number formatting and Phone number formatting.


III. Custom Formatting 

You can custom a formatting as required


2. Display

In Home Tab – Font feature 

Change font of the text , size, Colour

Fill colours in cell

Apply borders

Underline, Bold or Italic a character


3. Tools

Justify option allows the text copied from internet or word to be changed.


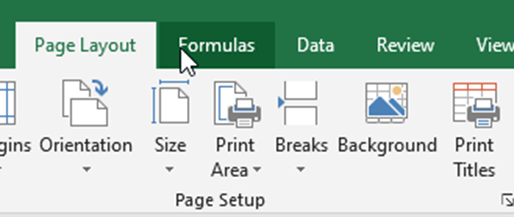
Background – Change background from Page layout option


4. Row & Column

Data with no Row or column formatting


After adjusting row and column


5. Outlining

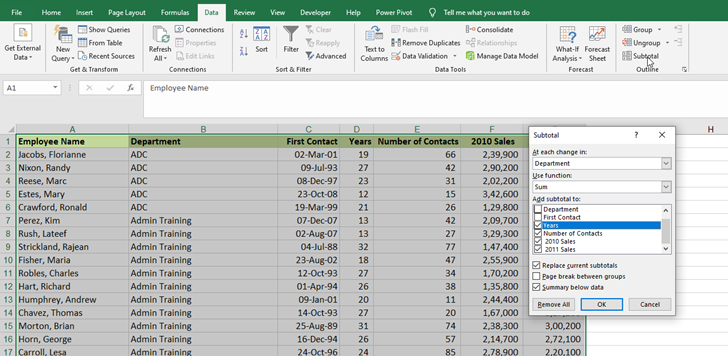
Data Tab – Outline -- Subtotal


After Outline


Grouping

Data Tab – Outline -- Group


6. Visualization

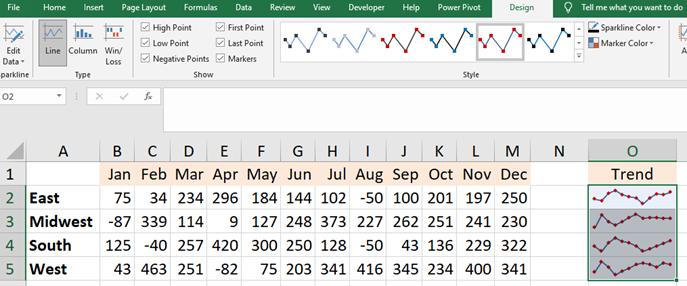
Sparklines – Insert High, Low, first, last, negative markers.


WordArt


Shape Effects


Themes

Pagelayout – Colours or Themes


7. Conditional

Home – Conditional Formatting – there are various options for formatting as shown in image. 


Conditional Formatting with Formula


Comments

Popular posts from this blog

20 Power BI Dax Measures

Power bi 20 dax measures 20 DAX (Data Analysis Expressions) measures in Power BI with examples: Total Sales: scss Copy code Total Sales = SUM (Sales[Amount]) Average Sales Price: scss Copy code Avg Sales Price = AVERAGE (Sales[Amount]) Total Units Sold: mathematica Copy code Total Units Sold = SUM ( Sales [ Quantity ] ) Total Customers: scss Copy code Total Customers = COUNTROWS (Customer) Total Products: mathematica Copy code Total Products = COUNTROWS ( Product ) Maximum Sales Amount: scss Copy code Max Sales Amount = MAX (Sales[Amount]) Minimum Sales Amount: scss Copy code Min Sales Amount = MIN (Sales[Amount]) Sales Growth Percentage: mathematica Copy code Sales Growth % = ( Total Sales - [ Total Sales Last Year ] ) / [ Total Sales Last Year ] Total Profit: scss Copy code Total Profit = SUM (Sales[Profit]) Total Orders: scss Copy code Total Orders = COUNTROWS (Orders) Total Customers with Sales: css Copy code Total Customers with Sales = COUNTROWS( FILTER ...

Basics Of Excel

MS Excel is a massive application, so you need to know the basics which will help you to navigate Excel and access features. Below is the Image of Excel when you open it. There are 5 important areas in the screen. 1. Quick Access Toolbar:  This is a place where all the important tools can be placed. When you start Excel for the very first time, it has only 3 icons (Save, Undo, Redo). But you can add any feature of Excel to to Quick Access Toolbar so that you can easily access it from anywhere (hence the name). 2. Ribbon:  Ribbon is like an expanded menu. It depicts all the features of Excel in easy to understand form. Since Excel has 1000s of features, they are grouped in to several ribbons. The most important ribbons are – Home, Insert, Formulas, Page Layout & Data. 3. Formula Bar:  This is where any calculations or formulas you write will appear. You will understand the relevance of it once you start building formulas. 4. Spreadsheet Grid:  This is where all yo...

Import CSV In Power BI

  Import CSV file Click on Get Data à More à File option and select Text/CSV . Navigate to the CSV file which needs to be imported FL_insurance_sample.csv . Select the file and click on Open. FL_insurance_sampleDownload In the CSV window on top we have 3 dropdowns, preview of data and data load options.  Select Load and it will load to power query editor window. In the Power query editor the CSV file is loaded as a Queries . In power query editor we can edit, clean and transform the file as required. 3 Dropdowns and Data Load File Origin – Type of file origin. By default its 1252 Wester European (Windows). It’s the file type as per OS and region and country. Delimiter – Delimiter for column separation. By default it detects the delimiter from data , If the delimiter is not from the default options then we can select custom delimiter. Data Type Detection – By default it detects data types of columns based on top 200 rows, we can select entire data or do not detect data type ...