
Turn Data Sideways


Someone built this lookup table sideways, stretching across C1:N2. I realize that I could use HLOOKUP instead of VLOOKUP, but I prefer to turn the data back to a vertical orientation.

Copy C1:N2. Right-click in A4 and choose the Transpose option under the Paste Options. Transpose is the fancy Excel word for “turn the data sideways.”
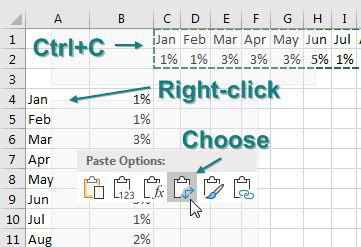
Copy the horizontal lookup table in C1:N2. Right-click in a blank cell. The fourth icon under Paste Options is called Transpose. Choose that and you will paste a sideways copy of the original table.

I transpose a lot. But I use Alt+ESEEnter to transpose instead of the right-click.

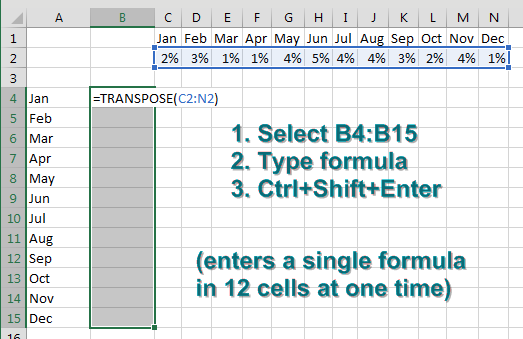
There is a problem, though. Transpose is a one-time snapshot of the data. What if you have formulas in the horizontal data? Is there a way to transpose with a formula?

The first way is a bit bizarre. If you are trying to transpose 12 horizontal cells, you need to select 12 vertical cells in a single selection. Start typing a formula such as =TRANSPOSE(C2:N2) in the active cell but do not press Enter. Instead, hold down Ctrl+Shift and then press Enter. This puts a single array formula in the selected cells. This TRANSPOSE formula is going to return 12 answers, and they will appear in the 12 selected cells, as shown below.

Select the 12 cells B4:B15. Type a formula =TRANSPOSE(C2:N2) but do not press Enter. Instead, hold while holding down Ctrl and Shift, press Enter. This enters a single formula in 12 cells at one time.

As the data in the horizontal table changes, the same values appear in your vertical table, as shown below.

The results: as the original formulas in C2:N2 recalculate, the results in the vertical range are updated.

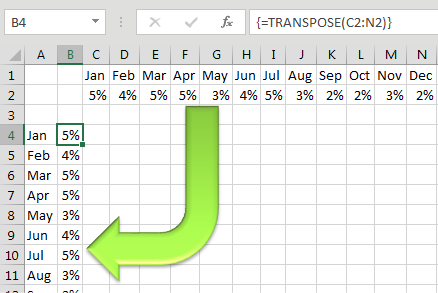
But array formulas are not well known. Some spreadsheet rookie might try to edit your formula and forget to press Ctrl+Shift+Enter.

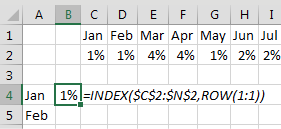
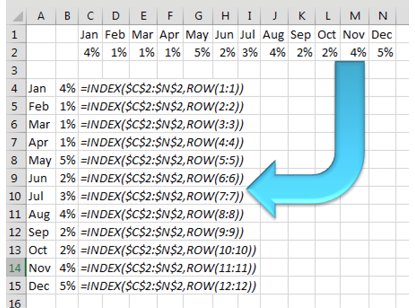
To avoid using the array formula, use a combination of INDEX and ROW, as shown in the figure below. =ROW(1:1) is a clever way of writing the number 1. As you copy this formula down, the row reference changes to 2:2 and returns a 2.

The INDEX function says you are getting the answers from C2:N2, and you want the nth item from the range.

A different solution that does not require Ctrl+Shift+Enter. The formula for January in B4 is =INDEX($C$2:$N$2,ROW(1:1)). The ROW(1:1) is a complicated way to write the number 1.

In the figure below, =FORMULATEXT in column C shows how the formula changes when you copy down.

As you copy that formula down, the reference to ROW(1:1) automatically changes to ROW(2:2) and so on.

Comments

Popular posts from this blog

Rank Function

How to Use the RANK Function If you give the RANK function a number, and a list of numbers, it will tell you the rank of that number in the list, either in ascending or descending order. For example, in the screen shot below, there is a list of 10 student test scores, in cells B2:B11. To find the rank of the the first student's score in cell B2, enter this formula in cell C2: =RANK(B2,$B$2:$B$11) Then, copy the formula from cell C2 down to cell C11, and the scores will be ranked in descending order. RANK Function Arguments There are 3 arguments for the RANK function: number : in the above example, the number to rank is in cell  B2 ref : We want to compare the number to the list of numbers in cells  $B$2:$B$11 . Use an absolute reference ($B$2:$B11), instead of a relative reference (B2:B11)so the referenced range will stay the same when you copy the formula down to the cells below order : (optional) This argument tells Excel whether to rank the list in ascending or descending o...

Charts - Make your data presentable

One-click charts are easy: Select the data and press  Alt+F1 . What if you would rather create bar charts instead of the default clustered column chart? To make your life easier, you can change the default chart type. Store your favorite chart settings in a template and then teach Excel to produce your favorite chart in response to  Alt+F1 . Say that you want to clean up the chart above. All of those zeros on the left axis take up a lot of space without adding value. Double-click those numbers and change Display Units from None to Millions. To move the legend to the top, click the + sign next to the chart, choose the arrow to the right of Legend, and choose Top. Change the color scheme to something that works with your company colors. Right-click the chart and choose Save As Template. Then, give the template a name. (I called mine ClusteredColumn.) Select a chart. In the Design tab of the Ribbon, choose Change Chart Type. Click on the Templates folder to see the template that ...