
Sum a cell through several Worksheets


You have 12 identical worksheets, one for each month. You would like to summarize each worksheet. Is there a better way than using =Jan ! B4 + Feb! B4+Mar! B4+Apr! B4…?

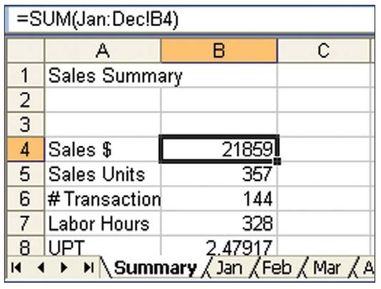
Solution: You can use a 3-D formula such as =SUM(Jan:Dec!B4), as shown in Figure 41.

Figure 41. A 3-D formula adds up all instances of B4 on the 12 sheets from Jan through Dec.

Figure 41. A 3-D formula adds up all instances of B4 on the 12 sheets from Jan through Dec.

Late-breaking Tip: To add up cell B4 on all the worksheets with Sales in the sheet name, type =SUM(‘*Sales’!B4) and press Enter.

If the first or last worksheet contains a space in the name, you have to use apostrophes around the pair of worksheet names: =SUM(‘Jan 2009: Dec 2009’!B4).

You can easily copy this formula to other cells on the summary worksheet. Gotcha: Do not drag the summary worksheet to appear after the Jan worksheet, or you will set up a circular reference.

Additional Details: It is possible to set up a named range that refers to a 3-D range. Here is an interesting way to set up a named range:

  1. Go to cell B4 on the Jan worksheet.
  2. Select Insert, Name, Define.
  3. The Refers To box contains =Jan!B4. Click in the box. Hold down the Shift key. Click on the Dec worksheet. The Refers To box changes to =Jan:Dec!B4.

Comments

Popular posts from this blog

20 Power BI Dax Measures

Power bi 20 dax measures 20 DAX (Data Analysis Expressions) measures in Power BI with examples: Total Sales: scss Copy code Total Sales = SUM (Sales[Amount]) Average Sales Price: scss Copy code Avg Sales Price = AVERAGE (Sales[Amount]) Total Units Sold: mathematica Copy code Total Units Sold = SUM ( Sales [ Quantity ] ) Total Customers: scss Copy code Total Customers = COUNTROWS (Customer) Total Products: mathematica Copy code Total Products = COUNTROWS ( Product ) Maximum Sales Amount: scss Copy code Max Sales Amount = MAX (Sales[Amount]) Minimum Sales Amount: scss Copy code Min Sales Amount = MIN (Sales[Amount]) Sales Growth Percentage: mathematica Copy code Sales Growth % = ( Total Sales - [ Total Sales Last Year ] ) / [ Total Sales Last Year ] Total Profit: scss Copy code Total Profit = SUM (Sales[Profit]) Total Orders: scss Copy code Total Orders = COUNTROWS (Orders) Total Customers with Sales: css Copy code Total Customers with Sales = COUNTROWS( FILTER ...

Basics Of Excel

MS Excel is a massive application, so you need to know the basics which will help you to navigate Excel and access features. Below is the Image of Excel when you open it. There are 5 important areas in the screen. 1. Quick Access Toolbar:  This is a place where all the important tools can be placed. When you start Excel for the very first time, it has only 3 icons (Save, Undo, Redo). But you can add any feature of Excel to to Quick Access Toolbar so that you can easily access it from anywhere (hence the name). 2. Ribbon:  Ribbon is like an expanded menu. It depicts all the features of Excel in easy to understand form. Since Excel has 1000s of features, they are grouped in to several ribbons. The most important ribbons are – Home, Insert, Formulas, Page Layout & Data. 3. Formula Bar:  This is where any calculations or formulas you write will appear. You will understand the relevance of it once you start building formulas. 4. Spreadsheet Grid:  This is where all yo...

Import CSV In Power BI

  Import CSV file Click on Get Data à More à File option and select Text/CSV . Navigate to the CSV file which needs to be imported FL_insurance_sample.csv . Select the file and click on Open. FL_insurance_sampleDownload In the CSV window on top we have 3 dropdowns, preview of data and data load options.  Select Load and it will load to power query editor window. In the Power query editor the CSV file is loaded as a Queries . In power query editor we can edit, clean and transform the file as required. 3 Dropdowns and Data Load File Origin – Type of file origin. By default its 1252 Wester European (Windows). It’s the file type as per OS and region and country. Delimiter – Delimiter for column separation. By default it detects the delimiter from data , If the delimiter is not from the default options then we can select custom delimiter. Data Type Detection – By default it detects data types of columns based on top 200 rows, we can select entire data or do not detect data type ...