1. Use tables to format data quickly
Excel Tables are an incredibly powerful way to handle a bunch of related data. Just select any cell with in the data and press CTRL+T and then Enter. And bingo, your data looks slick in no time. This has to be the best and easiest formatting tip.
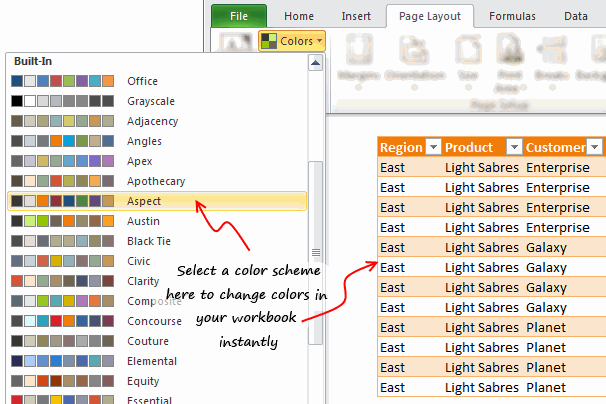
2. Change colors in a snap
So you have made a spreadsheet model or dashboard. And you want to change colors to something fresh. Just go to Page Layout ribbon and choose a color scheme from Colors box on top left. Microsoft has defined some great color schemes. These are well contrasted and look great on your screen. You can also define your own color schemes (to match corporate style). What more, you can even define schemes for fonts or combine both and create a new theme.
3. Use cell styles
Consistency is an important aspect of formatting. By using cell styles, you can ensure that all similar information in your workbook is formatted in the same way. For example, you can color all input cells in orange color, all notes in light gray etc.
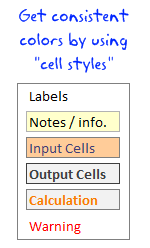
To apply cell styles, just select all the cells you want to have same style and from Home ribbon, select the style you want (from styles area).
4. Use format painter
Format painter is a beautiful tool part of all Office programs. You can use this to copy formatting from one area to another. See below demo to understand how this works. You can locate format painter in the Home ribbon, top left.
5. Clear formats in a click
Sometimes, you just want to start with a clean slate. May be it is that colleague down the aisle who made an ugly mess of the quarterly budget spreadsheet. (Hey, its a good idea to tell him about Chandoo.org) So where would you start?
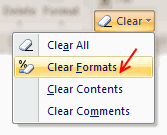
Simple, just select all the cells, and go to Home > Clear > Clear Formats. And you will have only values left, so that you can format everything the way you want.
6. Formatting keyboard shortcuts
Formatting is an everyday activity. We do it while writing an email, making a workbook, preparing a report, putting together a deck of slides or drawing something. Even as I am writing this post, I am formatting it. So knowing a couple of formatting shortcuts can improve your productivity. I use these almost every time I work in Excel.
- CTRL + 1: Opens format dialog for anything you have selected (cells, charts, drawing shapes etc.)
- CTRL + B, I, U: To Bold, Italicize or Underline any given text.
- ALT+Enter: While editing a cell, you can use this to add a new line. If you want a new line as part of formula outcome, use CHAR(10), and make sure you have enabled word-wrap.
- ALT+EST: Used to paste formats. Works like format painter (#4)
- CTRL+T: Applies table formatting to current region of cells
- CTRL+5: To
strike thru. - F4: Repeat last action. For example, you could apply bold formatting to a cell, select another and hit F4 to do the same.
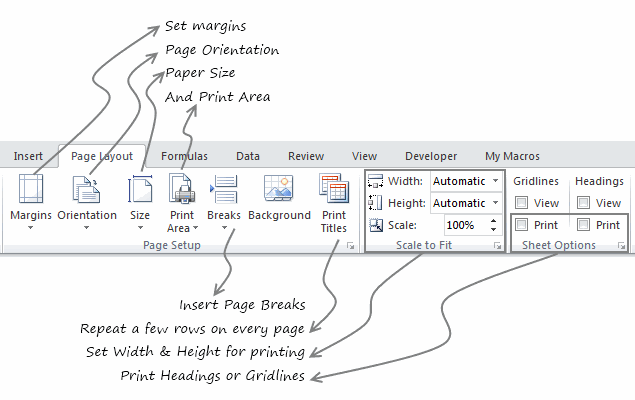
7. Formatting options for print
What looks great on your screen might look messed up, if you do not set correct print options. That is why, make sure that you know how to use these print settings. All of these can be accessed from Page Layout ribbon. For more, you can also use print preview and then “page settings” button.
8. Do not go overboard
Formatting your workbook is much like garnishing your food. No amount of plating & garnishing is going to make your food taste good. I personally spend 80% of time making the spreadsheet and 20% of time formatting it. By learning how to use various formatting features in Excel & relying on productive ideas like tables, cell styles, format painter & keyboard shortcuts, you can save a lot of time. Time you can use to make better, more awesome spreadsheets.
Comments
Post a Comment