Formulas & Functions
1.
Formulas
A formula is an expression
that operates on value in a range of cell or cells.
2.
Functions
Functions are predefined
formulas in excel which eliminate manual entry of formulas while give them
names.
Five Ways to Insert
Formula in Excel
2.
Using Insert Function in
Formulas Tab

3.
Selecting Formulas from one of
groups in Formula Tab
4.
Using AutoSum
5.
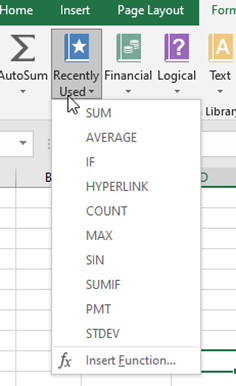
Recently Used from Formula Tab
Functions
There are more than 470 functions
in Excel and there are additions addin functions also with help of VBA macros
you can create your own formula.
Functions are distributed
in Below Categories:- Financial, Logical, Text, Date & Time, Lookup &
Reference, Math & Trig, More Functions.
We don’t need to learn all
formulas. I have listed down some important formulas which are used in
analysis.
1.
Financial Formulas
1.
NPV – Calculates the net
present value of cash flows based on a discount rate
Syntax = NPV(rate,value1,value2…)
Arguments –
1.
Rate is rate of discount over
the length of period
2.
Value1 is cashflow value. Only
number value is considered rest all is ignored
2.
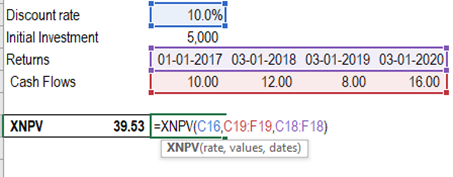
XNPV – calculates the NPV of
cash flows based on a discount rate and specific dates
Syntax = XNPV(rate,values,dates)
1.
Rate = Discount rate for a
period
2.
Values = Positive or negative
cash flows (an array of values)
3.
Dates = Specific dates (an
array of dates)
3.
IRR – this formula calculates
the internal rate of return (discount rate that sets the NPV to zero)
Syntax= IRR(values,[guess]
Values - Positive or negative cash flows (an array of
values)
Guess - An assumption of what you think IRR should be
4.
XIRR – calculates the internal
rate of return (discount rate that sets the NPV to zero) with specified dates
Syntax = XIRR(values,dates,guess)
5.
SLN – calculates depreciation
based on the straight-line method
Syntax = SLN(cost,salvage,life)
Cost – cost of asset when bought
Salvage – Value of asset after depreciation
Life – Number of period for which asset is depreciated
2.
Logical Formulas
1.
AND - It is used to determine
if the given conditions in a test are TRUE
Syntax = AND(logical1,logical2…)
2.
False - Returns the logical
value FALSE
Syntax = FALSE()
3.
IF - Specifies a logical test
to perform
Syntax =
IF(Logical_test,[value_if_true],[value_if_false])
4.
IFERROR - Returns a value you
specify if a formula evaluates to an error; otherwise, returns the result of
the formula. It can be used with other formulas to handle errors.
Syntax = IFERROR(value,value_if_error)
5.
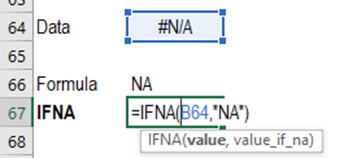
IFNA - Returns the value you
specify if the expression resolves to #N/A, otherwise returns the result of the
expression
Syntax = IFNA(value,value_if_na)
6.
NOT - Reverses the logic of its
argument
Syntax = NOT()
7.
OR - Returns TRUE if any
argument is TRUE, If neither condition is met, then it returns FALSE
Syntax = OR(logical1,logical2..)
8.
TRUE - Returns the logical
value TRUE
Syntax = TRUE()
9.
XOR - Returns a logical
exclusive OR of all arguments. With XOR the return is TRUE if the number of
true arguments is odd.
Syntax = XOR(logical1,logical2..)
3.
Text Formulas
1.
Left - Returns the left most
characters from a text value.
Syntax = LEFT(text,num_chars)
2.
Right - Returns the last character
or characters in a text string, based on the number of bytes you specify
Syntax = RIGHT(text,num_chars)
3.
Mid - Returns a specific number
of characters from a string starting at a specified position
Syntax = MID(text,start_num,num_chars)
4.
Proper - Capitalizes the first
letter in each word of a text value
Syntax = PROPER(text)
5.
Upper - Converts text to
uppercase
Syntax = UPPER(text)
6.
Lower - Converts text to
lowercase
Syntax = LOWER(text)
7.
LEN - Returns the number of
characters in a text string
Syntax = LEN(text)
8.
Trim - Removes all spaces from
text except single spaces between words
Syntax = TRIM(text)
9.
Substitute - Substitutes new
text for old text in a text string
Syntax = SUBSTITUTE(text,old_text,new_text,instance_num)
10.
Concatenate – Joins text in
various cells
Syntax = CONCATENATE(text,text2…)
4.
Date & Time Formulas
1.
Year - Converts an Excel date /
time serial number to a year
Syntax = YEAR(serial_number)
2.
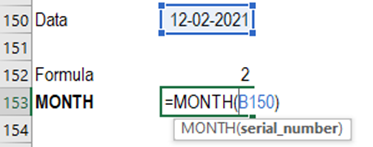
Month - The formula returns the
month number in the year of the date represented by the date / time serial
number.
Syntax = MONTH(serial_number)
3.
Today - The TODAY function
returns the current date according to the computer's system clock.
Syntax = TODAY()
4.
Now – Returns the Excel date /
time serial number of the current date and time. Volatile.
Syntax = NOW()
5.
Hour, Minute, Second
6.
NETWORKDAYS - The Excel
Networkdays function calculates the number of work days between two supplied
dates (including the start and end date). The calculation includes all weekdays
(Mon - Fri), excluding a supplied list of holidays.
Syntax = NETWORKDAYS(start_date,end_date,holidays)
7.
EOMONTH - The Excel Eomonth
function returns the last day of the month, that is a specified number of
months before or after an initial supplied start date.
Syntax = EOMONTH(start_date,months)
5.
Lookup & Reference Formulas
1.
MATCH - Returns the relative
position of an item in an array that matches a specified value in a specified
order. Important mainly as a feeder to other lookup functions because it returns
the position of an item in a range.
Syntax = MATCH(lookup_value,lookup_array,match_type)
2.
INDEX - An unusual function
that takes alternative forms depending upon whether the first argument is an
array or a reference. It is one of the most valuable functions for extracting
data from tables whether as individual items, entire rows, or columns. It is
used with other functions especially with MATCH.
Syntax = INDEX(array,row_num,column_num)
=
INDEX(reference,row_num,column_num,area_num)
3.
OFFSET - Returns a reference to
a range that is a specified number of rows and columns from a cell or range of
cells. Often used with calculated row and column numbers to return a cell or
range address.
Syntax = OFFSET(reference,rows,cols,[height],[width])
4.
VLOOKUP - Looks in the first
column of an array and moves across the row to return the value of a cell
Syntax =
VLOOKUP(lookup_value,table_array_index_num,range_lookup)
=
range_lookup has 2 options TRUE for approx. match and FALSE for exact match
5. HLOOKUP - Looks in the top row of a table or array and returns the value of the indicated cell.
Syntax = HLOOKUP(lookup_value,table_array_index_num,range_lookup)
6.
ROW & COLUMN – Gives row
and column number reference
7.
HYPERLINK – Creates hyperlink
8.
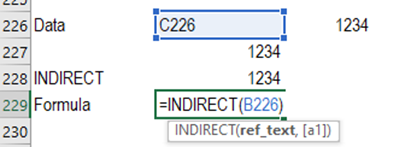
INDIRECT - Returns a reference
indicated by a value provided as text.
6. Statistical, INFO & Math functions
1.
2.
Average – Returns average i.e
arithmetic mean of arguments
3.
COUNT – Counts number of cells
in range that contain numbers
4.
COUNTA – Counts number of cell
in a range that are not empty
5.
COUNTBLANK – Counts number of
blank cells
6.
ISBLANK – If a cell value is
blank it will give output as TRUE
7.
MAX & MIN
MAX = Gives max number in a range
MIN = Gives min number in a range
8.
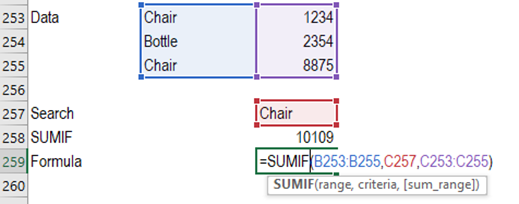
SUMIF
Syntax = SUMIF(range,criteria,sum_range)
9.
Product – Multiplies all
arguments
Syntax = PRODUCT(number1,number2…)
10. Round, Roundup, Rounddown – Round decimal numbers













Comments
Post a Comment